Yesterday, April 4, 2025, the U.S. stock market has indeed been experiencing significant declines.
Reports indicate that Wall Street benchmarks have seen some of their largest single-day percentage drops in years, driven largely by fears surrounding President Donald Trump’s sweeping tariff policies.
These tariffs, including a baseline 10% levy on most U.S. imports and higher rates on specific countries (e.g., 34% on China, 20% on the EU), have sparked concerns about an escalating global trade war and the potential for a recession.
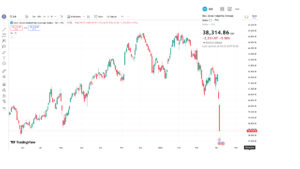
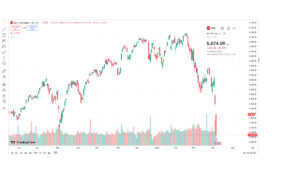
The S&P 500, Nasdaq, and Dow Jones Industrial Average have all been hit hard, with the S&P 500 losing nearly 5% and the Dow dropping over 2100 points in a single session earlier this week, marking their worst daily performances since 2020.
The market’s downturn is also fueled by uncertainty over economic growth, persistent inflation pressures, and a shift in investor sentiment away from riskier assets like tech stocks, which had previously driven gains in 2023 and 2024.

Companies like Apple, Nvidia, and Tesla have seen sharp declines, exacerbating the broader market sell-off.
Meanwhile, safe-haven assets like U.S. government bonds and gold have gained traction as investors seek stability amid the volatility.
Sectors Taking the Biggest Hits
1. Technology: Tech stocks, especially the “Magnificent Seven” (Apple, Nvidia, Tesla, etc.), are bleeding out. Nvidia’s down over 6% in a single day this week, and Tesla’s taken a similar beating.
The tariff talk is spooking investors since these companies rely heavily on global supply chains—China’s a big player here, and a 34% tariff could jack up costs or tank demand.
Plus, the AI hype that fueled 2024 gains is cooling off as recession fears grow.
2.Consumer Discretionary: Retail and auto stocks are tanking too. Think Ford and GM—down 5-7%—because tariffs could make imported parts pricier and slow consumer spending.
Amazon’s also feeling the heat, dropping nearly 5%, as higher import costs might squeeze margins or force price hikes.
3.Industrials: Companies like Caterpillar and Boeing are getting clobbered, with losses around 4-6%. These firms are exposed to international trade, and a global slowdown triggered by tariffs could crush demand for heavy machinery and planes.
Analyst Predictions
Goldman Sachs is warning of a potential 10-15% further drop in the S&P 500 if trade tensions escalate into a full-blown war.
Morgan Stanley’s calling this a “correction with legs”—they think we’re past the peak of the bull run that started in 2023.
On the flip side, some at JPMorgan argue it’s a buying opportunity, saying the market’s overreacting to tariff threats that might not fully materialize.
They’re eyeing a rebound if Trump softens his stance or if the Fed steps in with rate cuts—though with inflation still sticky, that’s a big “if.”
Futures markets are pricing in volatility, with the VIX (fear index) spiking above 40, a level not seen since mid-2023.
How VIX is performing
the CBOE Volatility Index (VIX)—often called Wall Street’s “fear gauge”—is showing some serious action.
Based on the latest available data and market chatter, the VIX has spiked significantly this week amid the U.S. market’s sharp decline.Earlier this week, it was reported to have surged 40%, hitting levels around 30-42 during regular trading hours.
Posts on X suggest it’s climbed as high as 42.51, reflecting intense volatility as the S&P 500 and other major indexes tanked—think 4-6% drops in a single session.
This spike puts the VIX in rare territory—historically, a reading above 37 ranks in the top 97% of all daily closes since 1990, signaling genuine panic.
It’s not just a blip either; the VIX has been climbing as Trump’s tariff threats (10% across the board, 34% on China) fuel fears of a trade war and recession.
The VVIX (volatility of the VIX) also popped above 140 today, per X posts, marking this as a full-on “volatility event.”
Historically, when the VIX hits these extremes, it can foreshadow a bottoming process, though it’s not a precise timing tool.
The underperformance of VIX earlier in the sell-off (not doubling despite a 600-point S&P drop over two weeks) had some pointing to heavy outright selling rather than hedging, but that’s flipped now with the rush to safety.
VIX Calculation:
- Above 30 → Extreme fear, possible capitulation (a tradable bounce may follow).
- Back Below 20 → Calmer conditions returning, suggesting the sell-off is stabilizing.
- Futures & Term Structure→ If inverted (near-term VIX higher than later months), it signals near-term stress.